Drawing
A draw K line in a cell draws what the notebook concluded as a picture of kind K. The picture is made of facts, so it can be checked like any others. A never over it is an invariant, why on a mark is a proof, and excise before a draw shows what one fact changes.
Every picture on this page is generated by npm run guide from the example it names, and npm run guide -- --check fails when one is stale. On the published guide each picture is drawn live by the same modules VS Code draws with: click a group to open or shut it, a mark to see its facts, and Full screen to see it whole. On GitHub, where no script runs, the page shows the renderer's SVG where it draws one, and for the graph kinds, which need a browser to lay them out, their mermaid, which GitHub draws.
How a notebook draws
- Read a view vocabulary. It lists the words a picture is made of:
visual/graph.rofl.md(a mark, a link, a group),visual/time.rofl.md(a lane, an interval, a message),visual/table.rofl.md(a row, a column, a value),visual/space.rofl.md(a point, a box, an axis) andvisual/notation.rofl.md(a person, a birth, a family). They ship with ROFL, so a notebook names one without a path:reads: [rofl:visual/graph.rofl.md]. - Say, in rules, what is a mark. For example, "a car X is a node if X is on the line", or "X links to Y if X is to be painted Y". These rules are the adapter from your domain to the picture.
- Ask for it.
draw graph,draw time,draw table,draw spaceanddraw notationdraw the five families. Each dialect and form below has a name of its own.
In VS Code the picture draws under the cell. On the command line, rofl-nb F.rofl.md prints its counts and its text: mermaid, DOT, Argdown, Vega-Lite, GeoJSON, a Markdown table or GEDCOM. Add --format F to choose one of these, and --json to get the view with its provenance.
What every picture carries
- Status. The renderer tags a mark itself; these tags are reserved, and an adapter cannot write them: -
failing: aneverin the notebook names it. -dangling: a link points at no mark. -unknown: the inquiry rules say nobody knows it. -blind: it comes from a file the model could not read. -goneandnew: anexcisein the cell removed or added it. - Why. Click a mark in VS Code: the facts it rests on are said in sentences, one proof step down.
- What-if.
excise Fand thendraw Kin one cell draws the picture after the retraction. What the retraction took away is taggedgone, and what it let through is taggednew. - Frames.
frame(M, F)puts a mark in frameF. The picture becomes small multiples, one per frame in order, and each frame is compared with the one before it. - Zoom.
collapsed(G)shuts a group into one mark labelled with how many marks it holds, and a click opens it again. What a group is depends on the kind: - a graph: what isinsideit; - a timeline: the lanes in alane_group; - a proof: the facts under a fact. - Pin layout. In VS Code, a graph's picture can be pinned:
placed(M, X, Y)facts are written beside the notebook, and a notebook that reads them draws each mark there.
Graph
A mark and the links between marks, drawn in VS Code as a schema: groups are frames that open and shut, a note points at a mark with a bright arrow, a link carries a small table of its terms, and a frame lays out its marks as layers, lanes, a matrix, a timeline, a quadrant and more (docs/schemas.md). Which picture answers which question is the book visual/viewpoints.rofl.md. Each dialect is the graph's vocabulary plus tags the dialect gives a meaning and a look.
graph
paint-shop.rofl.md: the cars on the line, an arrow to the colour each is to be painted. The cars that leave unpainted fail a never; c3's arrow points at a colour the shop does not have, so it dangles.
flowchart LR
  m1["c1"]
  m2["c2"]
  m3["c3"]
  m4["c4"]
  m5["pink"]
  subgraph g0["shop"]
    m0["blue"]
    m6["red"]
    m7["white"]
  end
  m1 --> m0
  m2 --> m6
  m3 -.-> m5
  linkStyle 2 stroke:#b91c1c,stroke-dasharray:4 3
  classDef failing stroke:#b91c1c,stroke-width:3px,color:#b91c1c
  classDef dangling stroke:#b91c1c,stroke-dasharray:4 3,color:#b91c1c
  class m3 unpainted
  class m3 failing
  class m4 unpainted
  class m4 failing
  class m5 dangling
  class m5 failing
argument
deploy-argument.rofl.md: a claim, the evidence for and against it, each claim with its grade. draw argument writes Argdown; the same view draws as a graph.
[cheap_to_run] #unknown

[fast_enough] #supported
  + <bench_p99>

[safe_to_ship] #contested
  + <canary_clean>
  - <incident_4711>
  + [tests_cover_payments] #supported
    + <suite_green>
flowchart LR
m0["bench_p99"]
m1["canary_clean"]
m2["cheap_to_run"]
m3["fast_enough"]
m4["incident_4711"]
m5["safe_to_ship"]
m6["suite_green"]
m7["tests_cover_payments"]
m0 --> m3
m1 --> m5
m4 -->|attack| m5
m6 --> m7
m7 --> m5
classDef unknown stroke:#66706b,stroke-dasharray:2 3,color:#66706b
class m2 unknown
class m3 supported
class m5 contested
class m7 supportedarchitecture
shop-architecture.rofl.md: containers in their system's boundary and in their layers, drawn top down. A call from a service up into the web layer fails the never.
architecture-beta
  group g0(cloud)[shop]
  service c0(server)[billing] in g0
  service c1(internet)[customer]
  service c2(server)[orders] in g0
  service c3(database)[orders_db] in g0
  service c4(server)[session] in g0
  service c5(internet)[stripe]
  service c6(server)[web] in g0
  c0:B --> T:c4
  c0:B --> T:c5
  c1:B --> T:c6
  c2:B --> T:c0
  c2:B --> T:c3
  c6:B --> T:c2
  c6:B --> T:c4
  %% billing: failing
  %% customer: person
  %% orders_db: database
  %% session: failing
  %% stripe: external
state
order-states.rofl.md: states and the events between them, with an entry dot, a final ring and the current state highlighted. A state with a way in and no way out is stuck.
stateDiagram-v2
  state "cancelled" as s0
  state "cart" as s1
  state "delivered" as s2
  state "paid" as s3
  state "refund_pending" as s4
  state "shipped" as s5
  [*] --> s1
  s1 --> s0: abandon
  s1 --> s1: add_item
  s1 --> s3: pay
  s3 --> s4: refund
  s3 --> s5: ship
  s5 --> s2: deliver
  s0 --> [*]
  s2 --> [*]
  classDef failing stroke:#b91c1c,stroke-width:3px
  classDef current stroke-width:3px,font-weight:bold
  class s0 final
  class s1 initial
  class s2 final
  class s4 stuck
  class s4 failing
  class s5 current
process
claim-process.rofl.md: steps in the lane of whoever does them, a gateway where the flow branches. A step nothing flows into is unreachable.
flowchart LR
  subgraph g1["clerk"]
    m1["check"]
    m2(["closed"])
    m3{"covered"}
    m5["pay"]
    m6["reject"]
  end
  subgraph g2["customer"]
    m4(["filed"])
  end
  subgraph g0["manager"]
    m0["appeal"]
    m7["review"]
  end
  m0 --> m7
  m1 --> m3
  m3 -->|yes| m5
  m3 -->|no| m6
  m3 -->|unsure| m7
  m4 --> m1
  m5 --> m2
  m6 --> m2
  m7 --> m5
  classDef failing stroke:#b91c1c,stroke-width:3px,color:#b91c1c
  class m0 failing
  class m2 finish
  class m3 decision
  class m4 start
causal
burnout-loop.rofl.md: quantities and the signed influences between them, laid on a ring so the loops show. An influence nobody measured has no sign.
flowchart LR
  m0["attrition"]
  m1["backlog"]
  m2["bugs"]
  m3["fatigue"]
  m4["morale"]
  m5["overtime"]
  m0 -->|+| m1
  m1 -->|+| m5
  m2 -->|+| m1
  m3 -->|+| m2
  m3 -->|-| m4
  m4 --> m0
  m5 -->|-| m1
  m5 -->|+| m3
  classDef failing stroke:#b91c1c,stroke-width:3px,color:#b91c1c
  class m0 failing
  class m4 unsigned
  class m4 failing
proof
claim-proof.rofl.md: the proof of each why in the cell as a tree. Each fact sits above the facts it rests on, down to the facts nobody concluded. A fact about a term nobody knows is drawn unknown. Shutting a fact folds its subproof into it. VS Code draws the tree upward; here it is the graph's mermaid, and on the command line the indented text why prints.
flowchart LR
  m0["check leads to covered"]
  m1["covered leads to pay"]
  m2["filed leads to check"]
  m3["filed opens the process"]
  m4["check is reached"]
  m5["covered is reached"]
  m6["filed is reached"]
  m7["pay is reached"]
  m8["check is followed by covered"]
  m9["filed is followed by check"]
  m10["covered is followed by pay when yes"]
  m10 --> m1
  m1 --> m7
  m8 --> m0
  m0 --> m5
  m9 --> m2
  m2 --> m4
  m3 --> m6
  m6 --> m4
  m4 --> m5
  m5 --> m7
  classDef unknown stroke:#66706b,stroke-dasharray:2 3,color:#66706b
  class m0 unknown
  class m2 unknown
  class m3 given
  class m4 unknown
  class m8 given
  class m8 unknown
  class m9 given
  class m9 unknown
  class m10 given
Time
Lanes and what happens in them, on one axis of time.
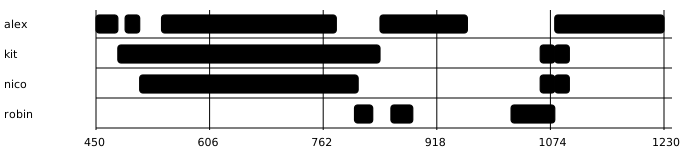
time: a Gantt chart
spat-thursday.rofl.md: a lane per person, a bar per thing they do, and a red bar wherever a child is alone while awake.
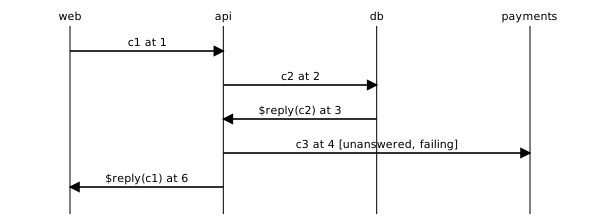
time: a sequence
checkout-sequence.rofl.md: marks that go from lane to lane draw as messages. A call that is never answered fails the never.
timeline
outage-timeline.rofl.md: what happened at a point, in order, on one axis. An alert that came late is red.

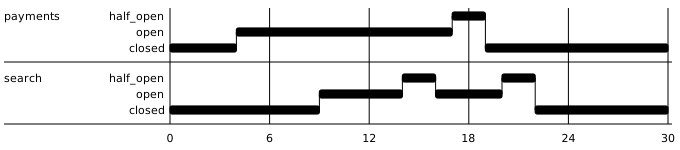
timing
breaker-timing.rofl.md: a signal per lane stepping between its states. A breaker open too long is red.
Table
Rows by columns by values.
table
coverage.rofl.md: a coverage matrix as a Markdown table. The rows the audits name are marked.
| l_x | l_y | |
|---|---|---|
| k_a [failing] | done | open [failing] |
| k_b | claimed | waived |
| k_c [failing] | open [failing] | done |
chart
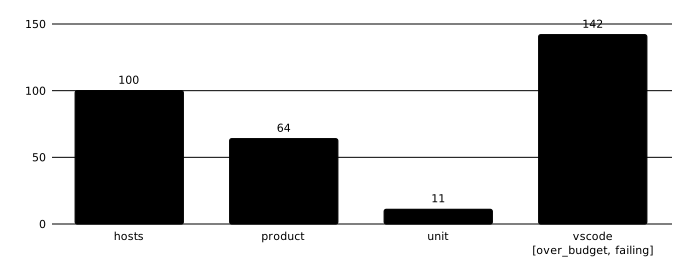
suite-chart.rofl.md: the mark draws names, on the channels shows names. A suite over its budget is red.
heatmap
coverage-heatmap.rofl.md: a cell coloured by its value. An open cell no work item claims is outlined red.

upset
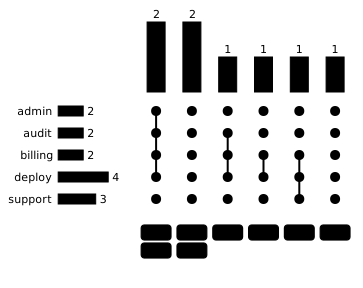
access-upset.rofl.md: with more sets than circles can hold, a bar per set and a column per intersection. A person in two duties at once is marked.
euler
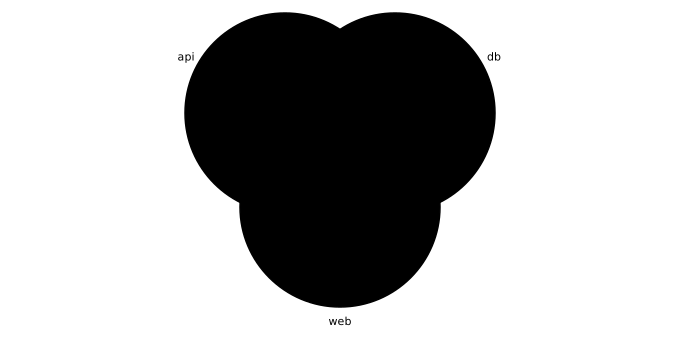
oncall-euler.rofl.md: three sets or fewer as circles, and each person in the region of exactly their sets.
decision
shipping-decision.rofl.md: in VS Code a rule per column, its conditions above its actions; here, its Markdown table, a rule per row. A gap and an overlap are both failures.
| big_order | discount | free_shipping | member | |
|---|---|---|---|---|
| $gap(no,no) [gap, failing] | no | no | ||
| r1 [overlaps, failing] | any | x | yes | |
| r2 | yes | x | no | |
| r3 [overlaps, failing] | yes | x | yes |
Space
The data is the geometry, so nothing is laid out.
space: a map
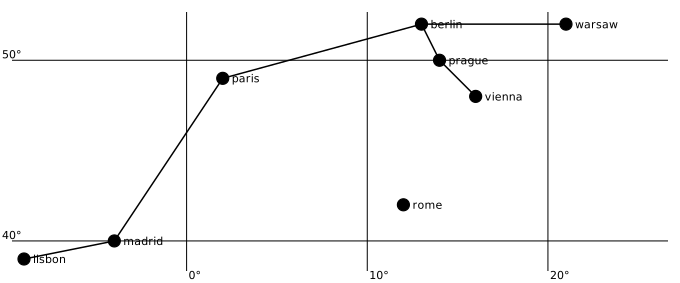
rail-map.rofl.md: stations at their longitude and latitude. A station no line reaches is red where it stands. On the command line the map is GeoJSON.
space: a plan
office-plan.rofl.md: rooms as boxes and desks as points. A desk in no room is red.
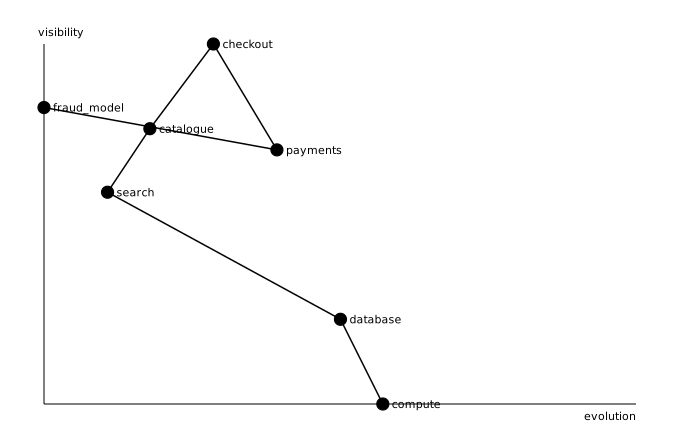
space: axes
wardley.rofl.md: components placed by how evolved and how visible they are. A component that depends on a more visible one breaks the chain's order.
Notation
When a domain has its own tool and standard, the notebook writes the file that tool reads. family-tree.rofl.md writes GEDCOM 7; in VS Code it is also drawn as a pedigree, generations down, with the child born before a parent marked failing, and Open as .ged puts the file beside the notebook.
0 HEAD
1 GEDC
2 VERS 7.0
1 NOTE drawn from a ROFL notebook by `draw notation`
0 @I1@ INDI
1 NAME Anna /Petrova/
1 BIRT
2 DATE 1950
1 FAMS @F1@
1 FAMC @F2@
0 @I2@ INDI
1 NAME Boris /Sokolov/
1 BIRT
2 DATE 1948
1 FAMS @F1@
0 @I3@ INDI
1 NAME Ivan /Petrov/
1 BIRT
2 DATE 1921
1 FAMS @F2@
0 @I4@ INDI
1 NAME Lena /Sokolova/
1 BIRT
2 DATE 1946
1 FAMC @F1@
0 @I5@ INDI
1 NAME Olga /Petrova/
1 BIRT
2 DATE 1925
1 FAMS @F2@
0 @F1@ FAM
1 HUSB @I1@
1 WIFE @I2@
1 CHIL @I4@
0 @F2@ FAM
1 HUSB @I3@
1 WIFE @I5@
1 CHIL @I1@
0 TRLR
The coverage of this page, drawn by itself
visual/vscode-coverage.rofl.md is the matrix that tracks how each kind above is covered in VS Code. Its rows are the kinds and its columns what "covered" means. Each cell is done with evidence, waived with a reason, claimed by open work, or open. It draws itself as a heatmap.